I highlighted how you can assess the
value of your campaigns average KPIs and how to identify outliers for
better campaign insights. I will continue showing
you how to improve the value of your campaign with some simple math
tips. We will continue to use the example of setting up a new ad group
to promote fireplace components.
If you remember from my last post, after we identified that we were going to focus on quality and service as the selling points for this new ad campaign, we developed two different forms of ad copy to reflect each campaigns’ different value proposition. I’ve listed out the results below. Now, what do you think? Should we remove Ad Copy #2 and just keep Ad Copy #1 because its average CTR is higher?
EXAMPLE One: CTR Performance Comparison Between Two Ad Copies

Step One: Use Standard Deviation to Remove Outliner
As illustrated in the Part I of this series, before comparing the averages, we need to separate outlier (i.e. values that fall outside 2 standard deviations from the average) from the rest of the values. As you can see, the CTR on Day 6 of Ad Copy #1 is outside a reasonable range, so we don’t include Day 6 while comparing the performance between Ad Copy #1 and Ad Copy #2.
EXAMPLE Two: Use Standard Deviation to Remove Outlier

Step Two: Use T-Test to Confirm the Difference
After removing the outlier, the updated average for Ad Copy #1 is 4% vs. 5% for Ad Copy #2. We can use a T-Test to confidently declare those two ad copies perform significantly different. (I am aware of any terms with “test” within could be intimidating so allow me to comfort you a bit by revealing that the T-Test was originally developed to test quality of beer. Call it Beer-Test if it soothes you. J) The following are things you need to know about this simple test:


To compare two ad copies with different standard deviations, we should apply 2 for tails and 3 for type while using Excel’s T-Test function and the formula looks like “=ttest(array of Ad Copy #1 CTRs, array of Ad Copy #2 CTRs, 2,3)” with an outcome of 0.4 which means: we cannot confidently declare those two ad copies perform differently because the chance of our assumption is wrong is 40% . Is it because there is no difference or we need more samples? Let’s add more power to our analysis.
Step Three: Use Power Analysis to Identify Sample Size
In a statistical test, power is the probability that the test result could help us confidently confirm our assessment and Power Analysis is a simple math we can use to calculate the minimum sample size which enables us to confidently decide whether those two ad copies perform differently. Before conducting Power Analysis, you need to know:
• Required parameters
In Part III of this series, we will re-visit those two ad copies’ performance. But until then, today’s takeaways are:
1. Having the right samples is a critical step for any analyses. Use Empirical Rule (aka 2-Standard-Deviations Away You Are Out Rule) to control the quality of the sample and use Power Analysis to check its quantity.
Power Analysis to check its quantity.
2. Don’t jump into conclusions based on face value of the numbers. Instead, apply a T-Test to confirm your assessments.
3. T-Test results only confirm one side of story (i.e. “those beers taste no different” does NOT confirm “those beers taste the same”), so clarify your assessment before put it to the test.
Email : naturalseosolution@gmail.com | Mo : 8763723377 | Skype : sunmoon.mohanty
If you remember from my last post, after we identified that we were going to focus on quality and service as the selling points for this new ad campaign, we developed two different forms of ad copy to reflect each campaigns’ different value proposition. I’ve listed out the results below. Now, what do you think? Should we remove Ad Copy #2 and just keep Ad Copy #1 because its average CTR is higher?
EXAMPLE One: CTR Performance Comparison Between Two Ad Copies

Step One: Use Standard Deviation to Remove Outliner
As illustrated in the Part I of this series, before comparing the averages, we need to separate outlier (i.e. values that fall outside 2 standard deviations from the average) from the rest of the values. As you can see, the CTR on Day 6 of Ad Copy #1 is outside a reasonable range, so we don’t include Day 6 while comparing the performance between Ad Copy #1 and Ad Copy #2.
EXAMPLE Two: Use Standard Deviation to Remove Outlier

Step Two: Use T-Test to Confirm the Difference
After removing the outlier, the updated average for Ad Copy #1 is 4% vs. 5% for Ad Copy #2. We can use a T-Test to confidently declare those two ad copies perform significantly different. (I am aware of any terms with “test” within could be intimidating so allow me to comfort you a bit by revealing that the T-Test was originally developed to test quality of beer. Call it Beer-Test if it soothes you. J) The following are things you need to know about this simple test:
- T-Test is an one-way test, if the outcome doesn’t support our assumption (i.e. two ad copies perform differently) it does NOT suggest the opposite is true (i.e. two ad copies perform the same)
- You can use it to validate the outcomes from Before/After Test on one set of objects
- You can use it to validate the outcomes from A/B Test on two sets of objects
- In general, T-Test value > 0.05 implies your assumption is NOT correct (i.e. the chance of your assumption is not correct > 5% )
- The easy way to perform a T-Test is using Excel T-Test function
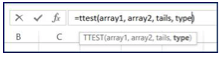
- Array 1: the first data set
- Array 2: the second data set
- To validate the conclusion of one data set performs better than the other
- To validate the conclusion of one data set performs differently from the other (i.e. could be better or worse)
- For Before/After Test
- For A/B Test with a same standard deviation
- For A/B Test with a different standard deviation other (i.e. could be better or worse)

To compare two ad copies with different standard deviations, we should apply 2 for tails and 3 for type while using Excel’s T-Test function and the formula looks like “=ttest(array of Ad Copy #1 CTRs, array of Ad Copy #2 CTRs, 2,3)” with an outcome of 0.4 which means: we cannot confidently declare those two ad copies perform differently because the chance of our assumption is wrong is 40% . Is it because there is no difference or we need more samples? Let’s add more power to our analysis.
Step Three: Use Power Analysis to Identify Sample Size
In a statistical test, power is the probability that the test result could help us confidently confirm our assessment and Power Analysis is a simple math we can use to calculate the minimum sample size which enables us to confidently decide whether those two ad copies perform differently. Before conducting Power Analysis, you need to know:
• Required parameters
- Tails
- One-tail: To validate the conclusion of one data set performs better than the other
-
- Two-tail: To validate the conclusion of one data set performs differently from the other
- Test value: the value you would like to compare to sample.
- Sample average
- Sample size
- Sample’s standard deviation
- Confidence level
- Result of Power Analysis is between 0 and 1.
- 0:0% possibility to confirm the assessment based upon the given parameters
- 1: 100% possibility to confirm the assessment based upon the given
- For conducting T-Test, we need an outcome of 0.8 or higher from Power Analysis to confirm our assessment parameters
In Part III of this series, we will re-visit those two ad copies’ performance. But until then, today’s takeaways are:
1. Having the right samples is a critical step for any analyses. Use Empirical Rule (aka 2-Standard-Deviations Away You Are Out Rule) to control the quality of the sample and use Power Analysis to check its quantity.
Power Analysis to check its quantity.
2. Don’t jump into conclusions based on face value of the numbers. Instead, apply a T-Test to confirm your assessments.
3. T-Test results only confirm one side of story (i.e. “those beers taste no different” does NOT confirm “those beers taste the same”), so clarify your assessment before put it to the test.
Email : naturalseosolution@gmail.com | Mo : 8763723377 | Skype : sunmoon.mohanty